
Dashboard Tour
Get a quick snapshot of how your organization is doing the moment you log in.
The dashboard is the first thing you see in Retain. Each widget is a quick read on your new hires, surveys, retention, and what's coming up. Use the Locations filter at the top to focus on certain locations, and the download button in the top right to save the dashboard's data.
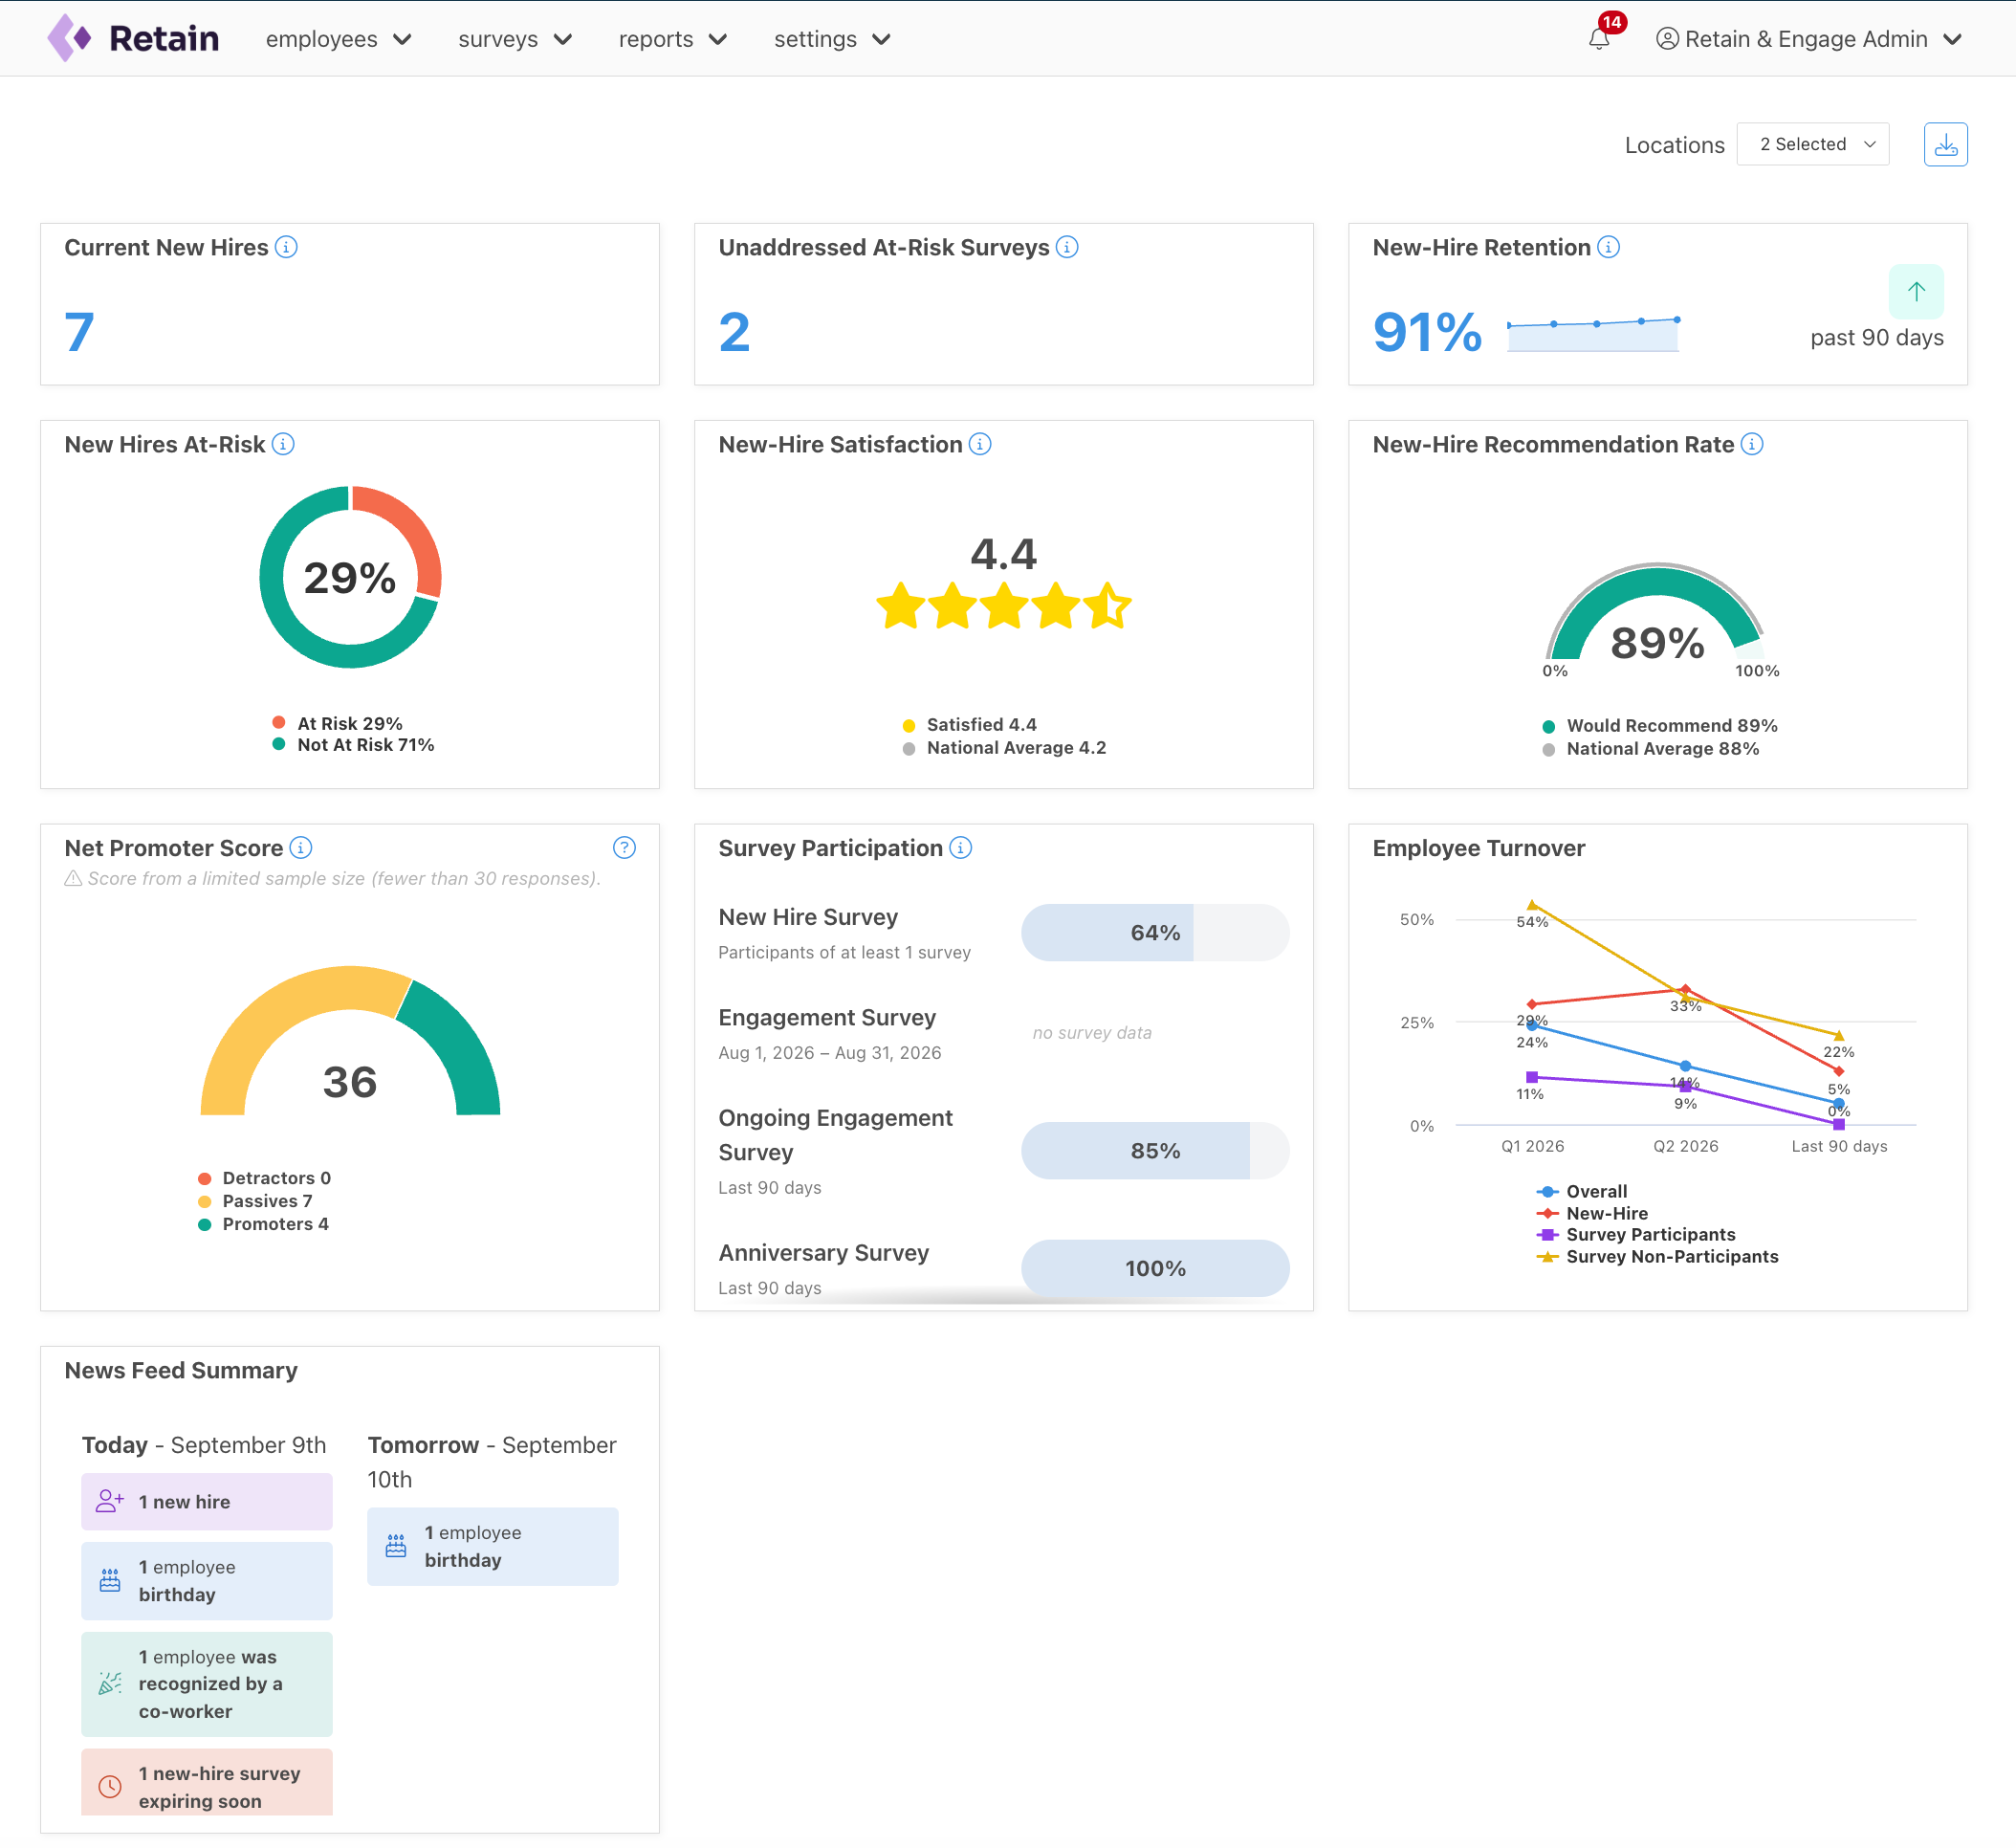
- Current New Hires — The number of employees in their first 100 days, so you know how many people are in the new-hire journey right now.
- Unaddressed At-Risk Surveys — How many at-risk surveys still need a response, so you can follow up before anyone slips through.
- New-Hire Retention — The share of new hires you've kept over the past 90 days, so you can see whether early retention is holding.
- New Hires At-Risk — The share of new hires flagged as at risk of leaving, so you can gauge how many may need a check-in. See who they are in the at-risk report.
- New-Hire Satisfaction — The average satisfaction rating from new-hire surveys, next to the national average, so you can see how new hires feel and how you compare.
- New-Hire Recommendation Rate — The percentage of new hires who'd recommend working for you, next to the national average, as a quick read on early loyalty.
- Net Promoter Score — Your employee Net Promoter Score (eNPS), a single measure of employee loyalty. Learn how it's calculated in the eNPS widget article.
- Survey Participation — Response rates for each survey type, so you can see which surveys people are actually taking.
- Employee Turnover — How turnover is trending over time, split by group (overall, new-hire, survey participants, and non-participants), so you can spot who's leaving and when. Dig in with the turnover report.
- News Feed Summary — A preview of today's and tomorrow's news feed items — new hires, birthdays, recognition, and expiring surveys — so you know what needs attention.